However, in the short term, this is not always the case: for various reasons, gaps and disconnects can arise between a company’s share price and its financial performance. This is one of the reasons why I believe it is essential for a long-term investor to remain optimistic and remember that investing is a marathon, not a sprint.
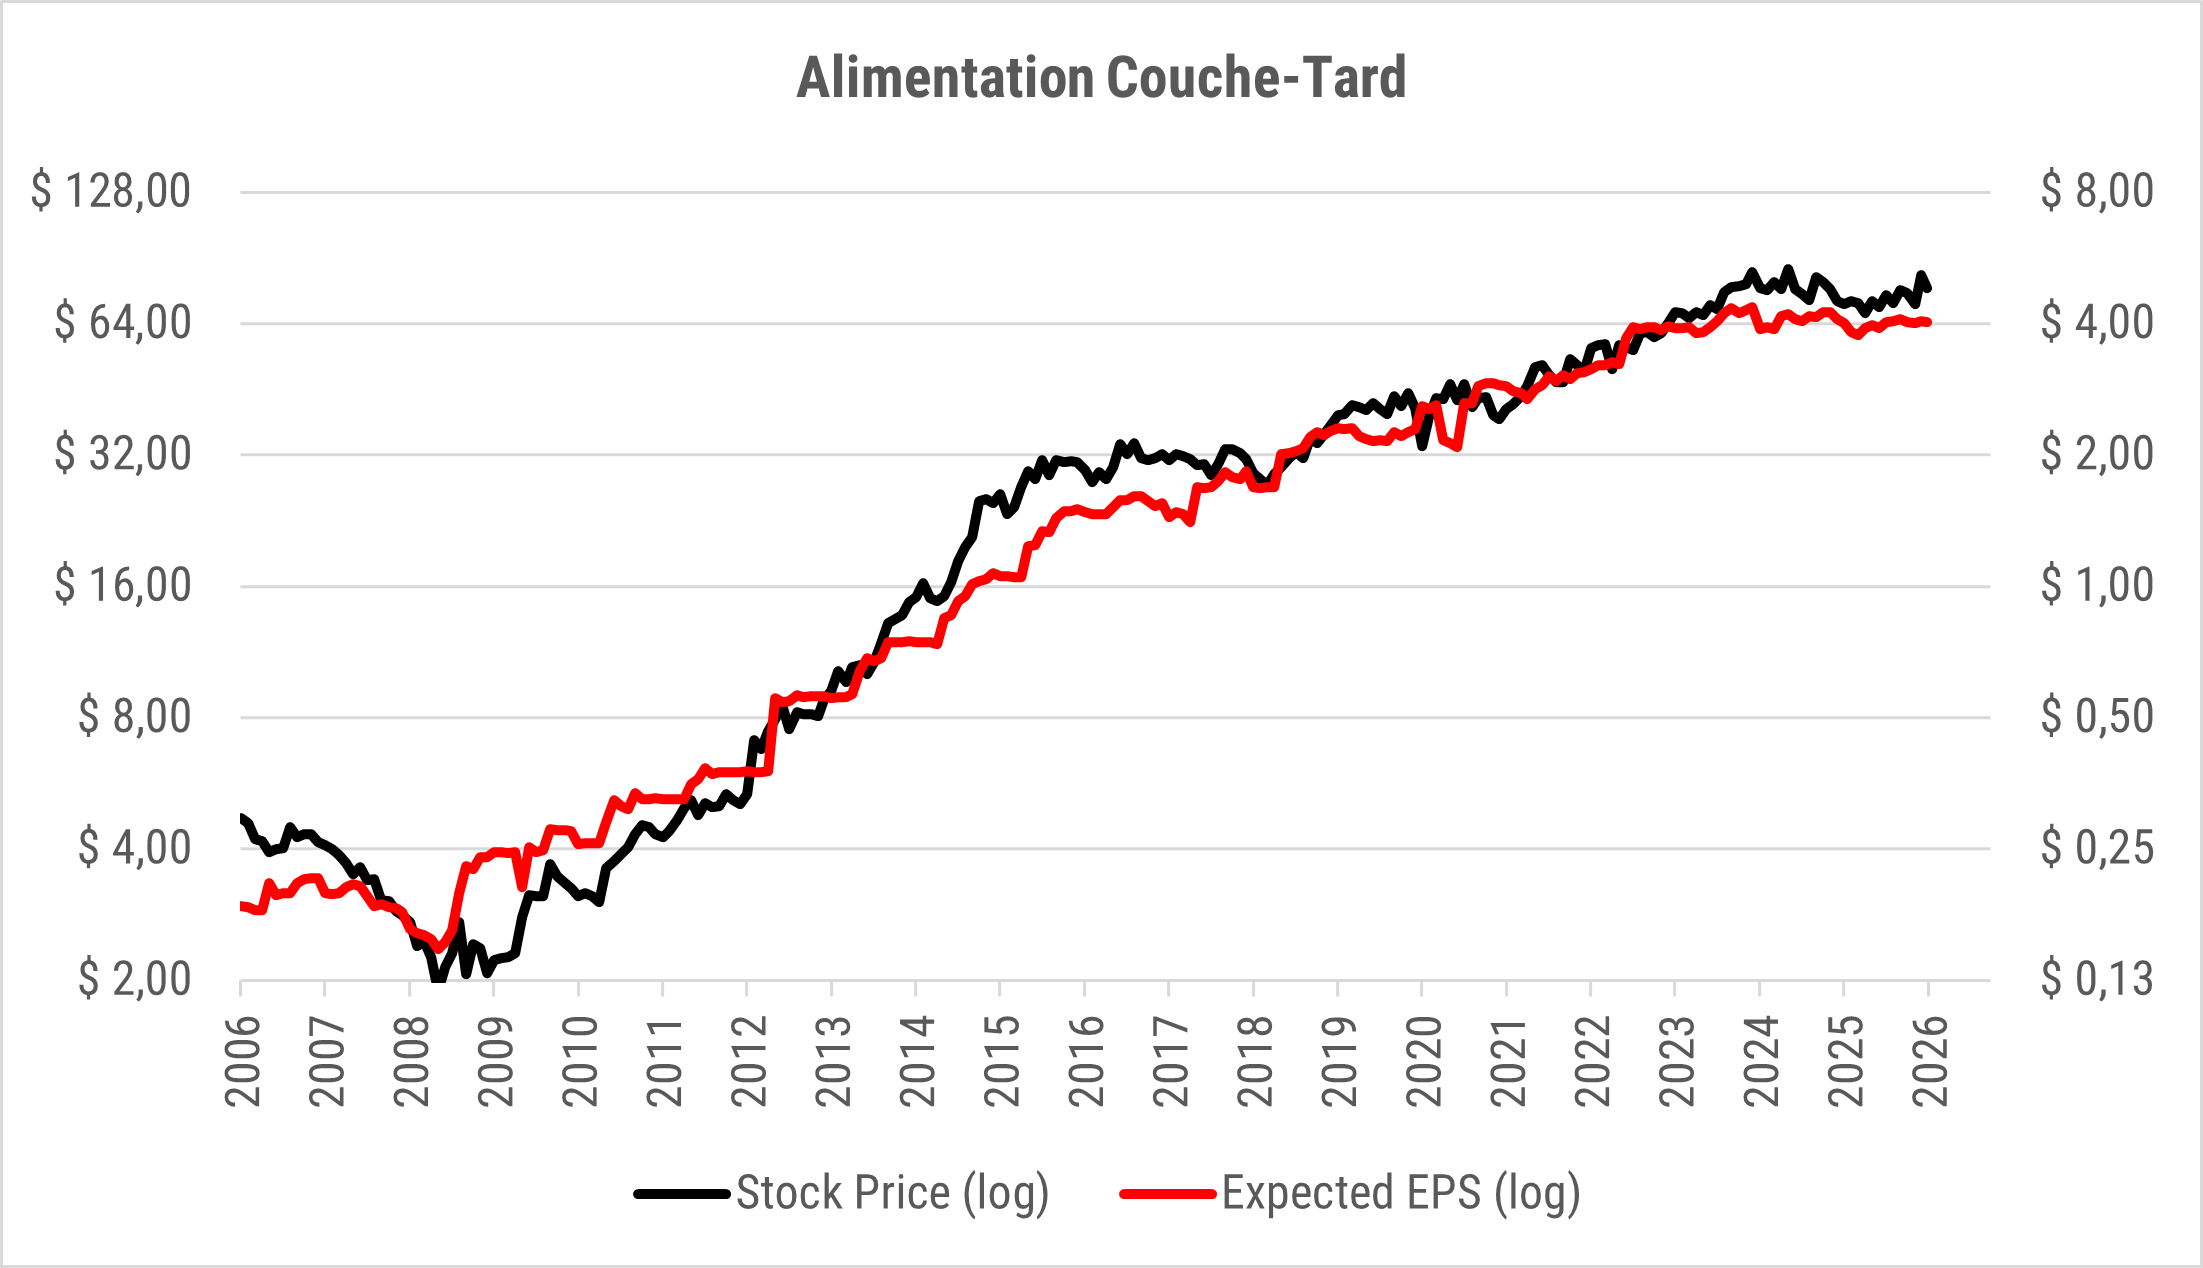
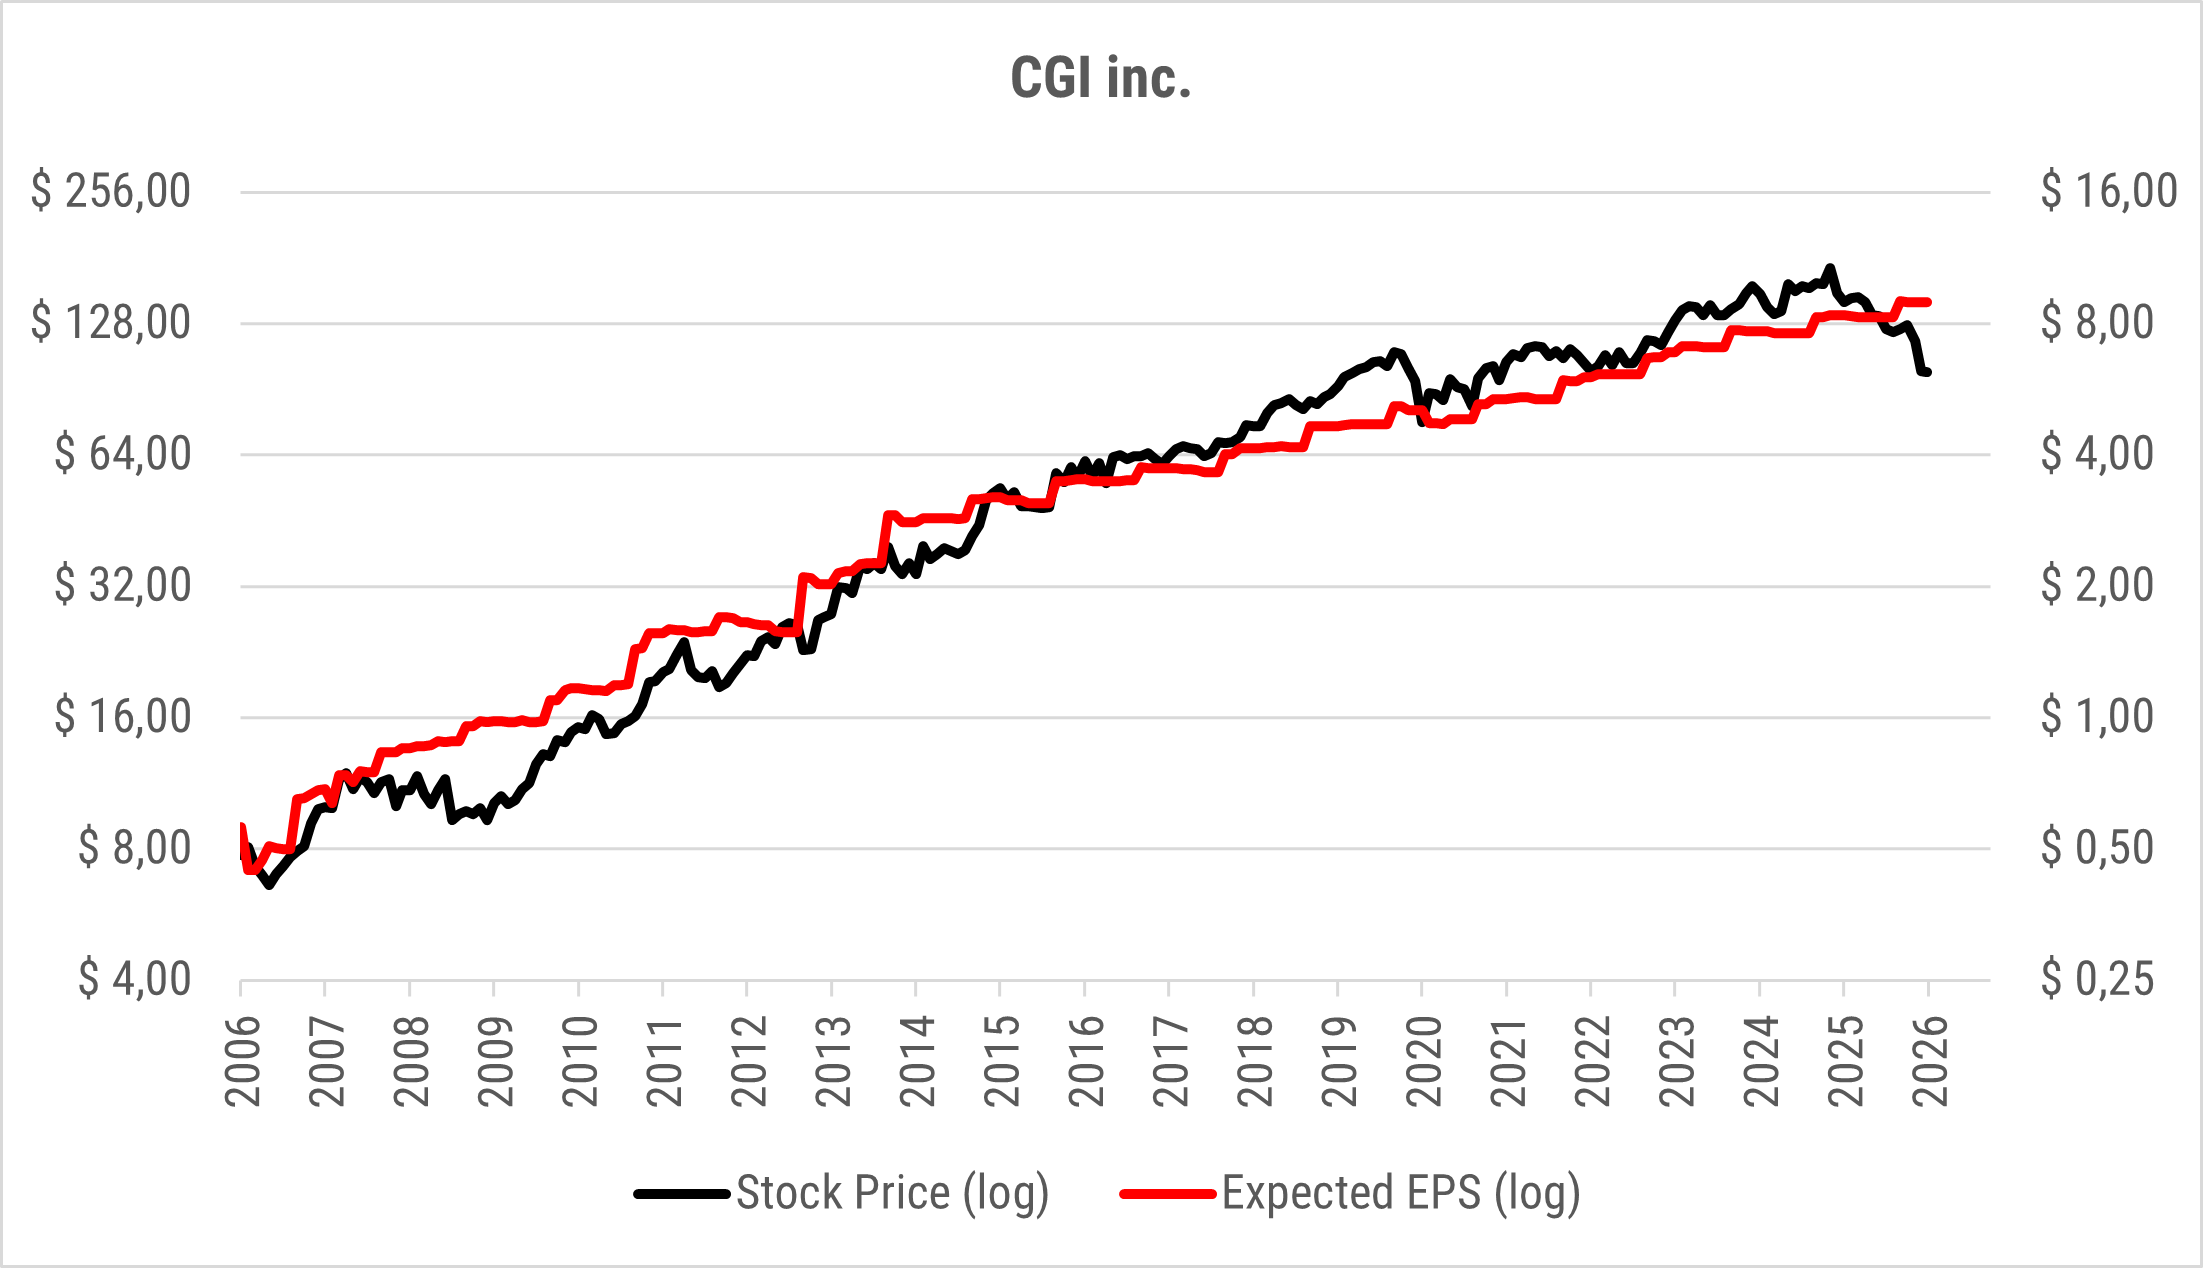
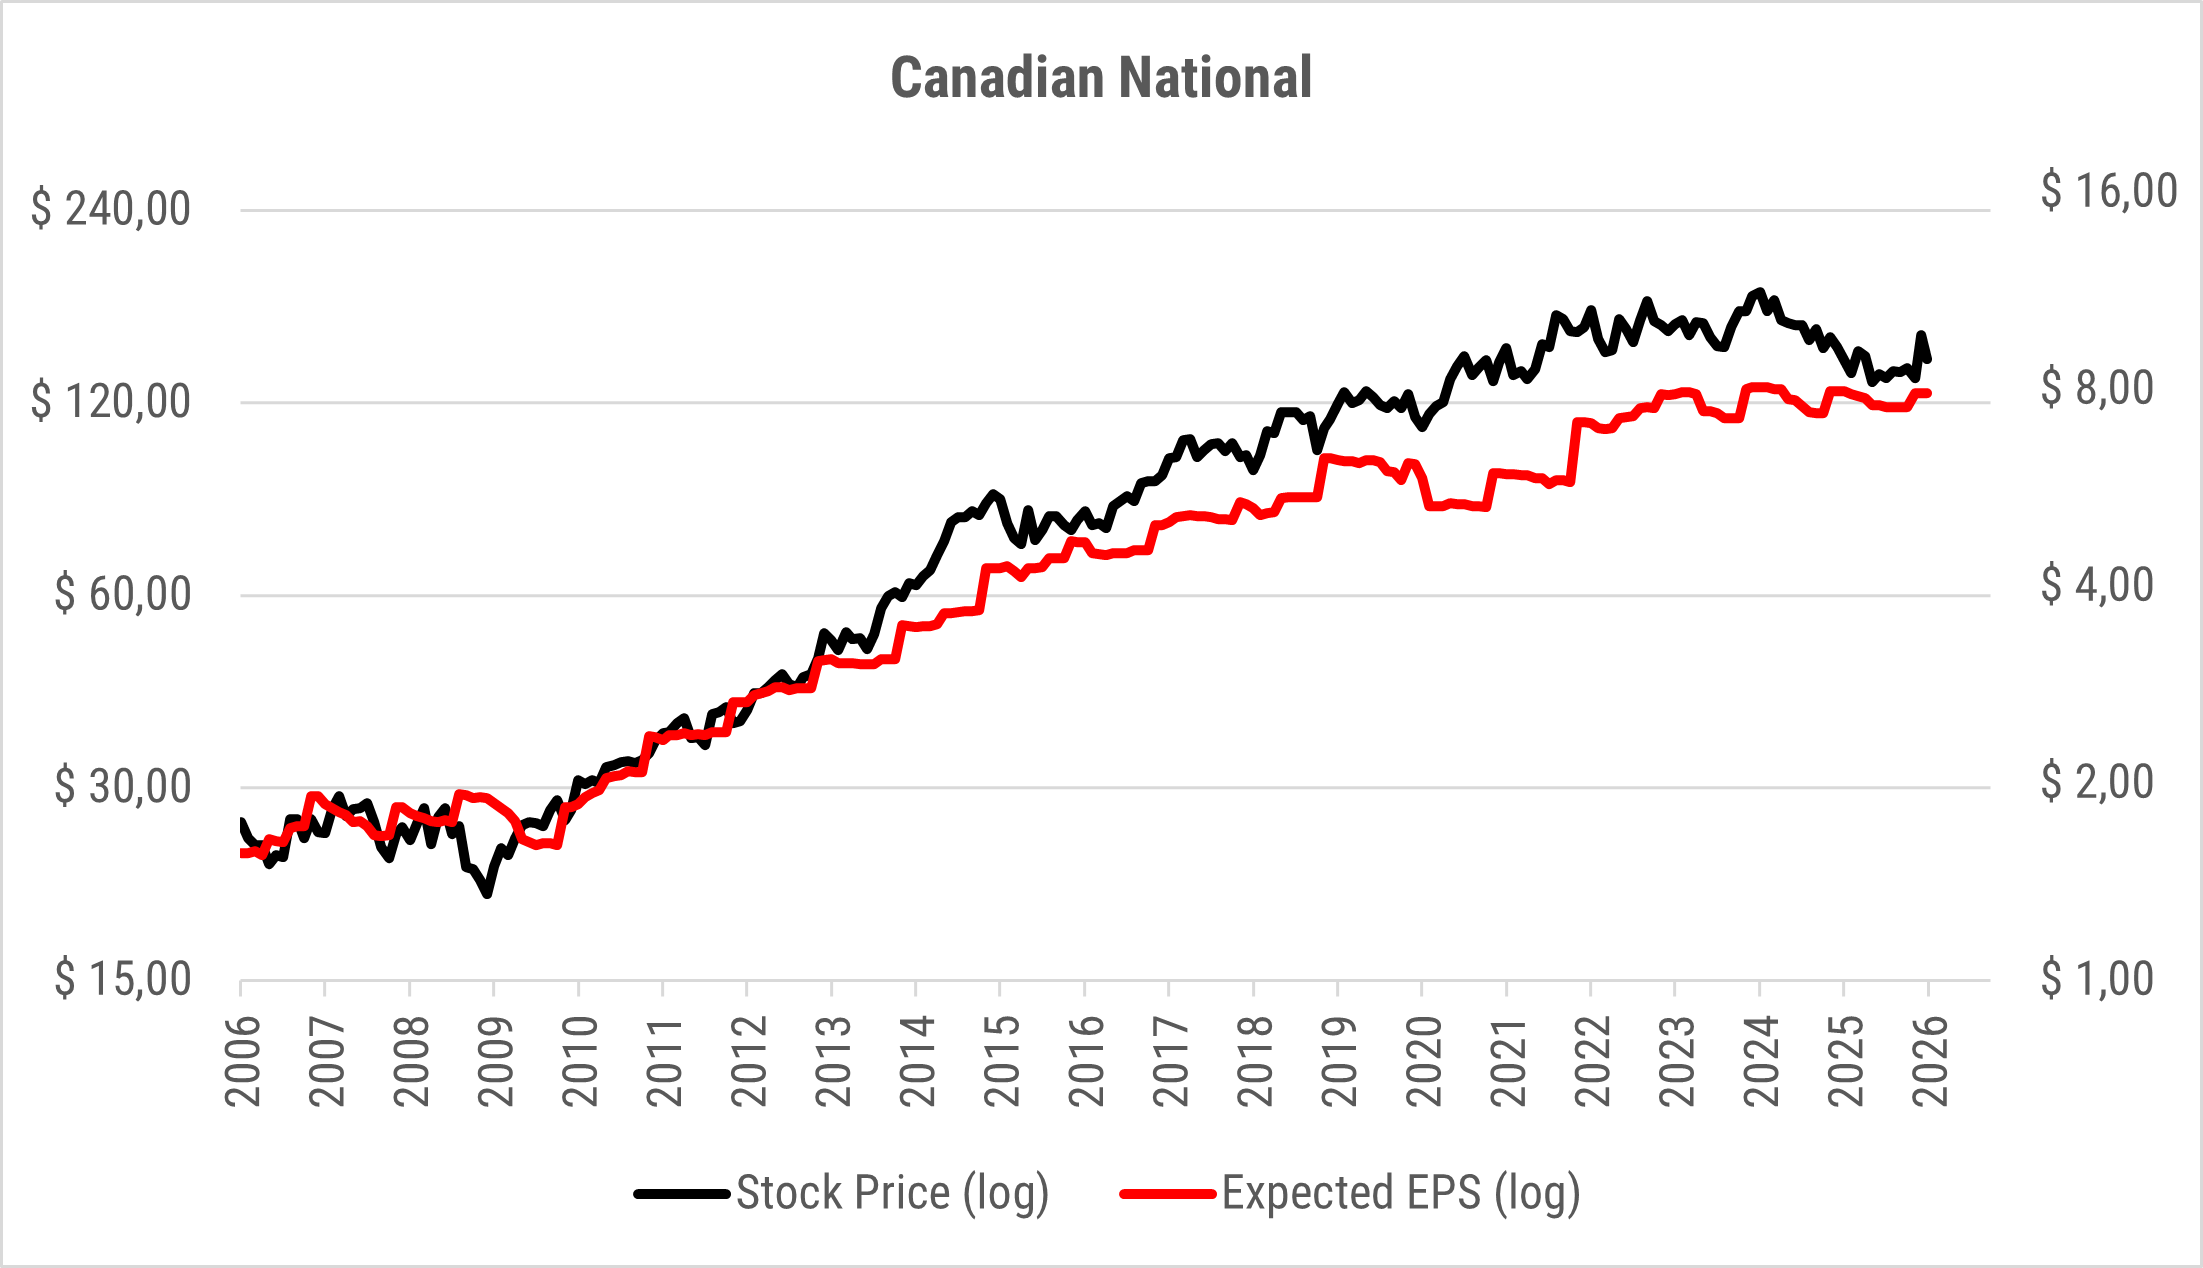
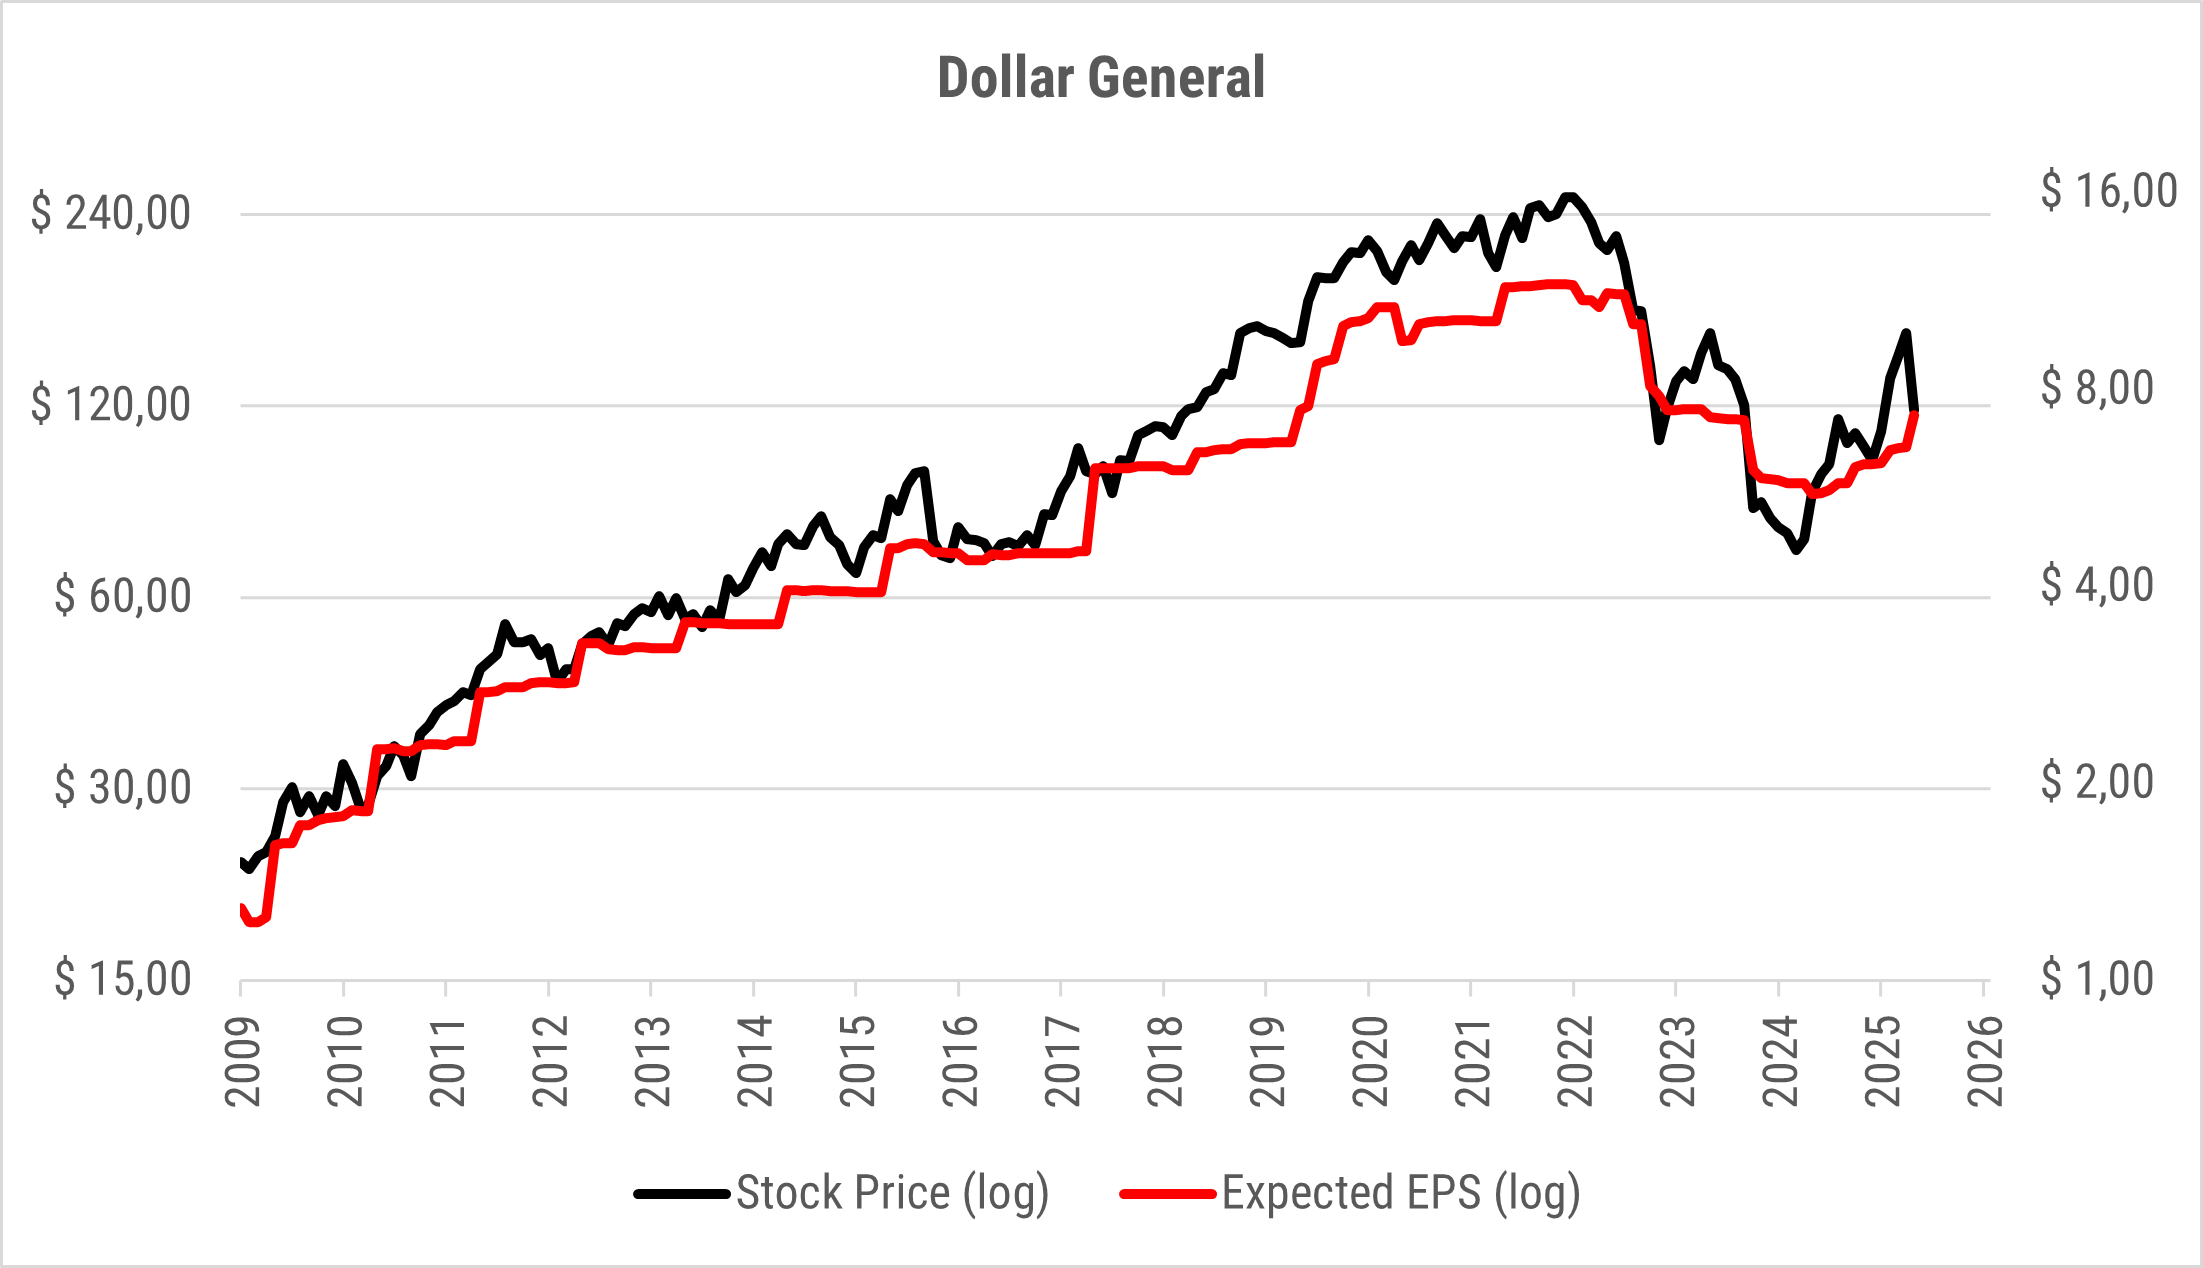
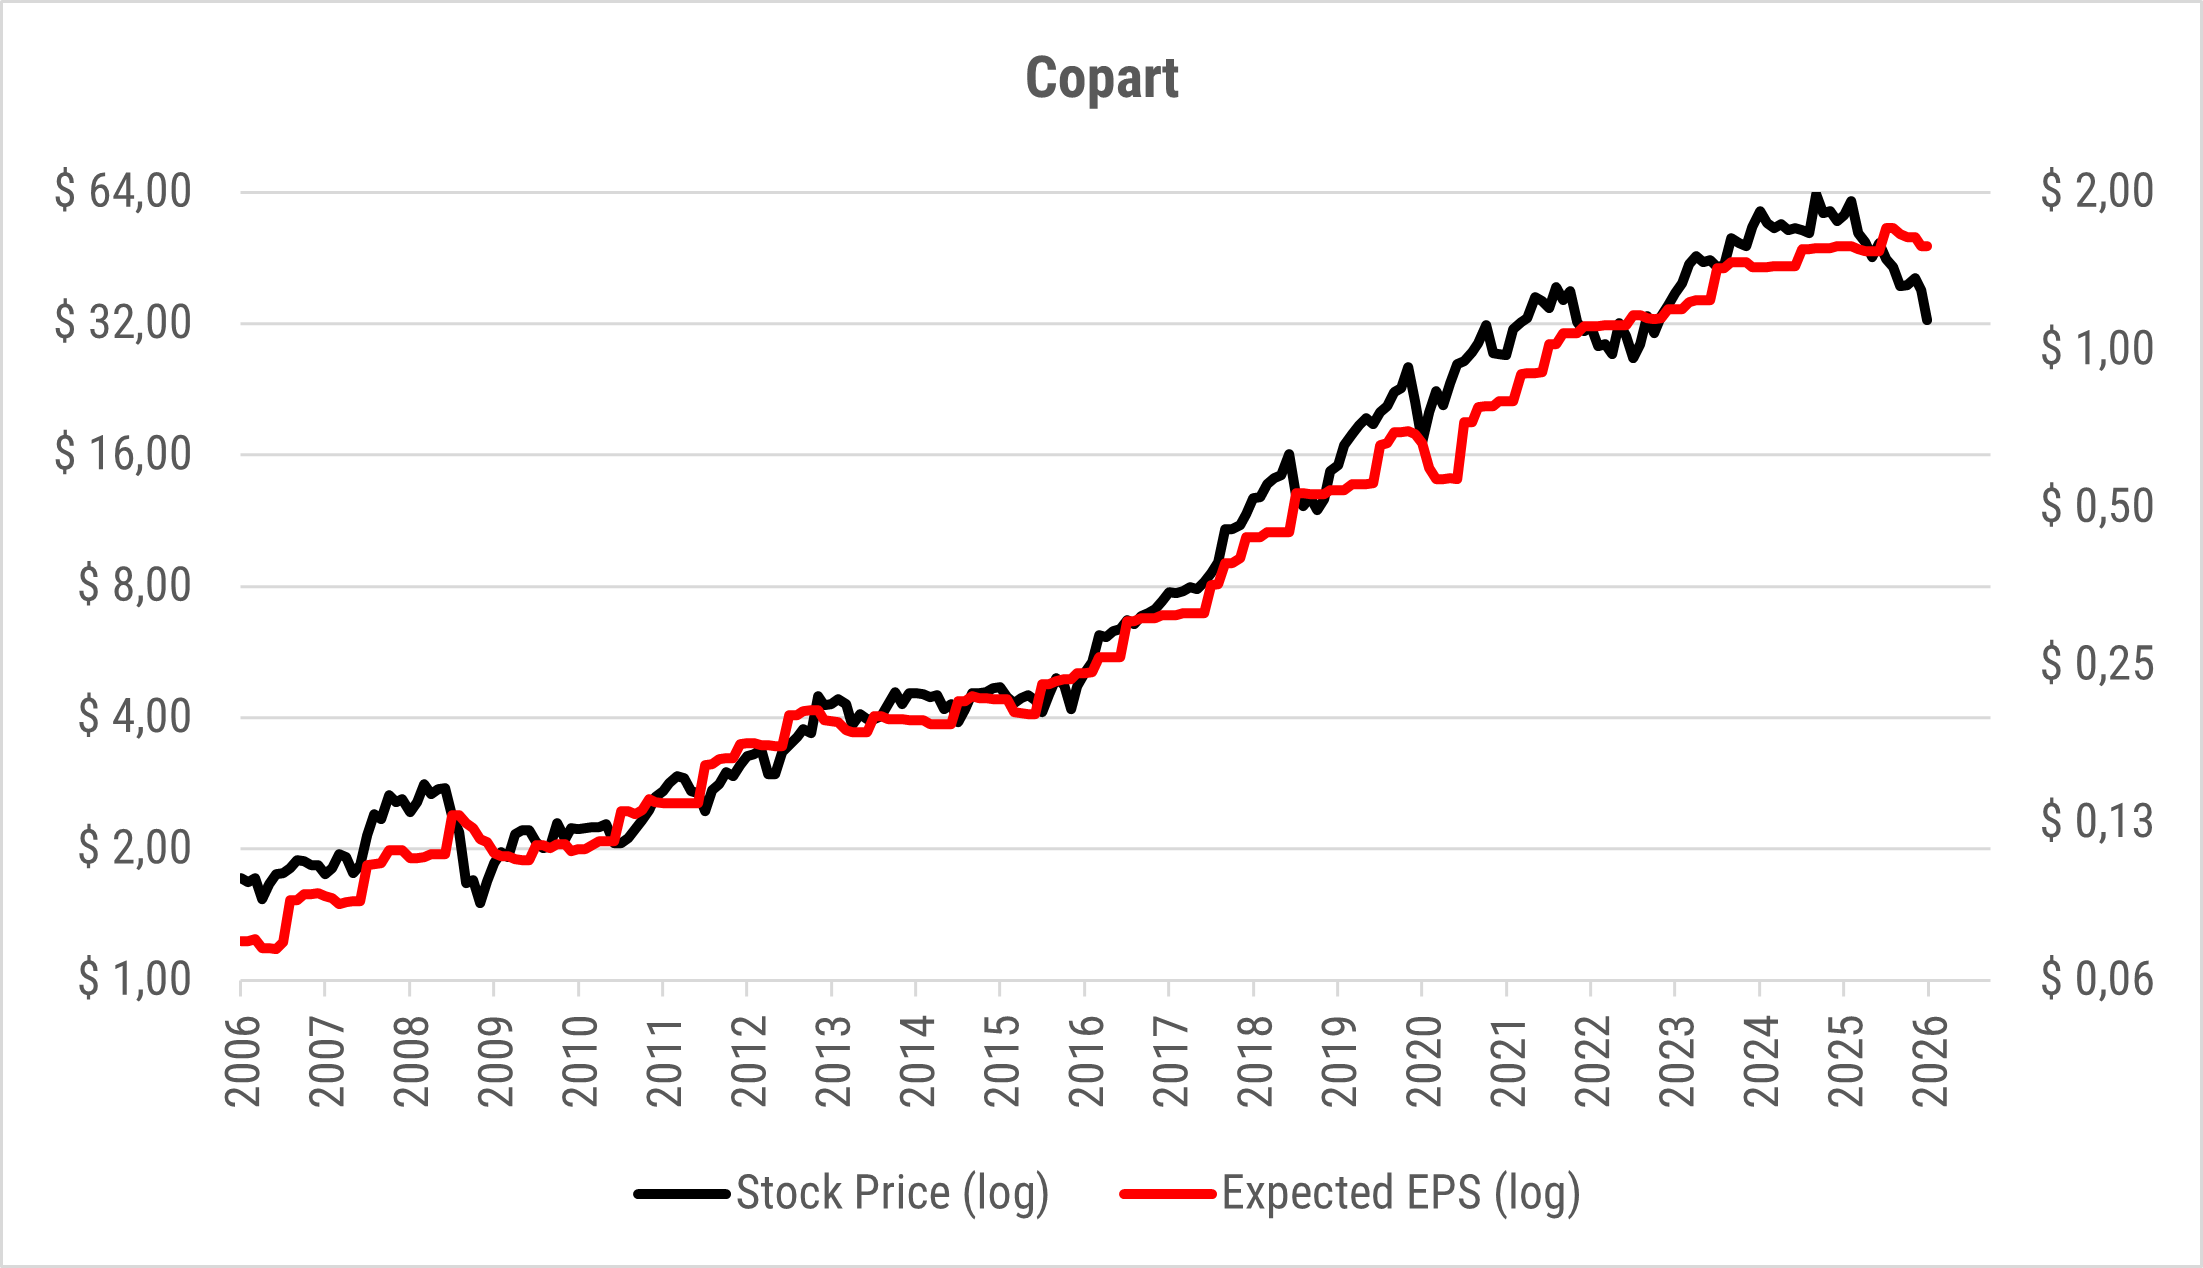
To support my view, here are five examples of stocks of companies we hold in our managed portfolios. In the charts that follow, I compare each stock’s price with the evolution of these companies’ expected EPS over the past 20 years. Note the logarithmic scale on the Y-axis.
Another way to verify the long-term convergence between EPS growth and share price performance is to compare them. Below are the compound annual growth rates for each of these five stocks over the past 10 years:
| Compound annual growth in adjusted EPS 2015-2025 |
Compound annual return of stock 2015-2025 (with dividends)* |
|
|---|---|---|
| Couche-Tard | 11,70 % | 12,10 % |
| CGI | 10,60 % | 9,90 % |
| Canadien National | 5,50 % | 7,10 % |
| Dollar General | 7,00 % | 8,00 % |
| Copart | 22,70 % | 22,20 % |
* Dividends reinvested in the stock
I am convinced of this, and I hope you are as well: over the long term, a stock’s price will follow the evolution of its EPS. As can be seen in some of the charts presented, there are sometimes disconnects between the two—this is what can create interesting investment opportunities.
Philippe Le Blanc, CFA, MBA
Chief Investment Officer at COTE 100
_______
This article is also published on  (in French)