In June 2022, the cash level stood at 21.2% compared to 15.1% in December 2021. Why such an increase?
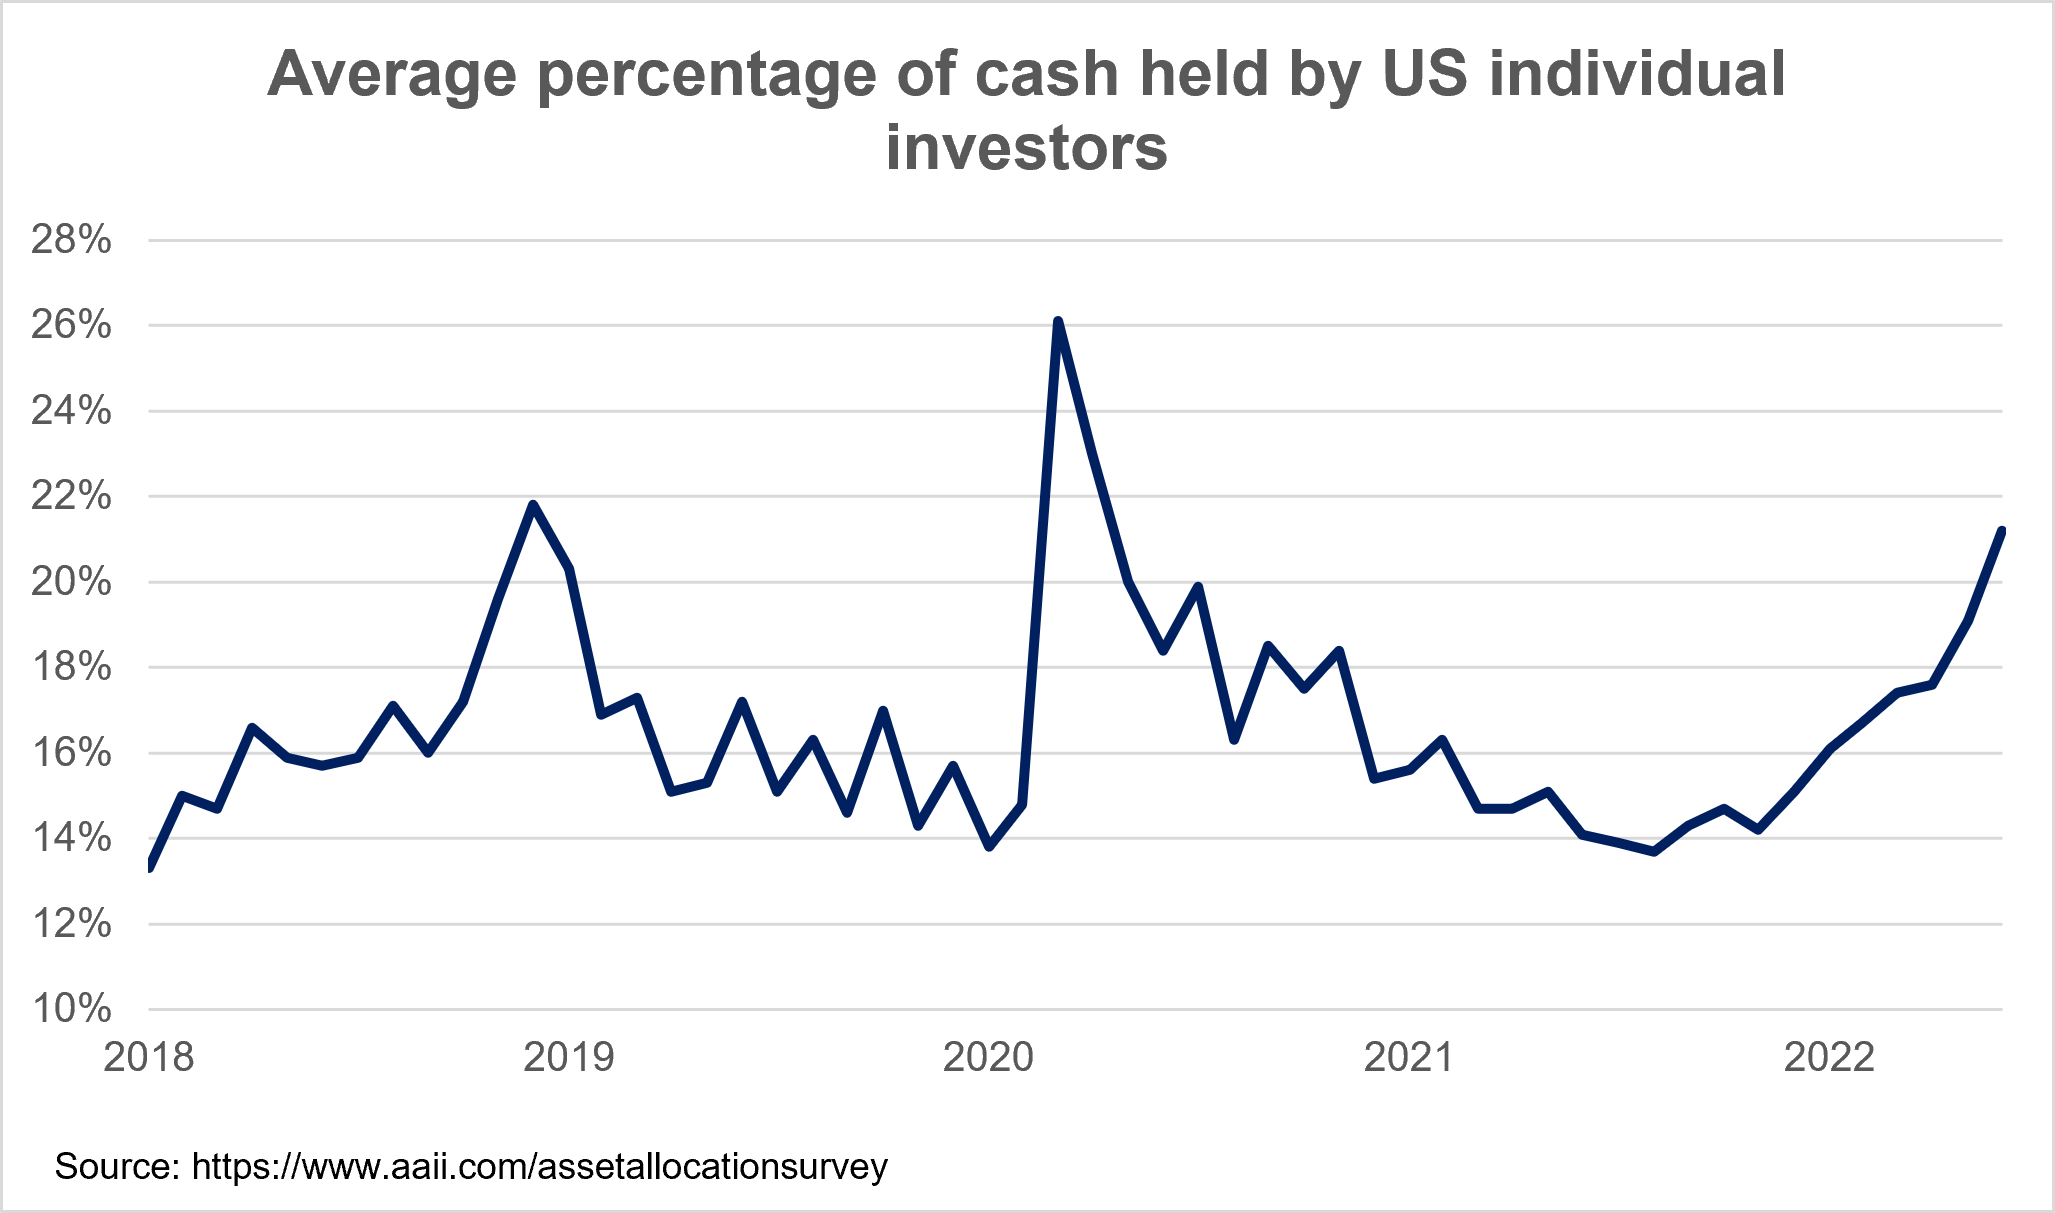
Falling stock markets naturally increase the cash weighting held in a portfolio. This is because, if cash remains stable and your stocks lose value, cash will make up a larger percentage of your portfolio.
In addition to this natural increase, I am convinced that the increase is also caused by certain investors who choose to take a portion of their investments out of the market. Inflation, rising rates, the risk of a recession and falling stock markets are worrying events for many.
Is it reasonable to hold so much cash?
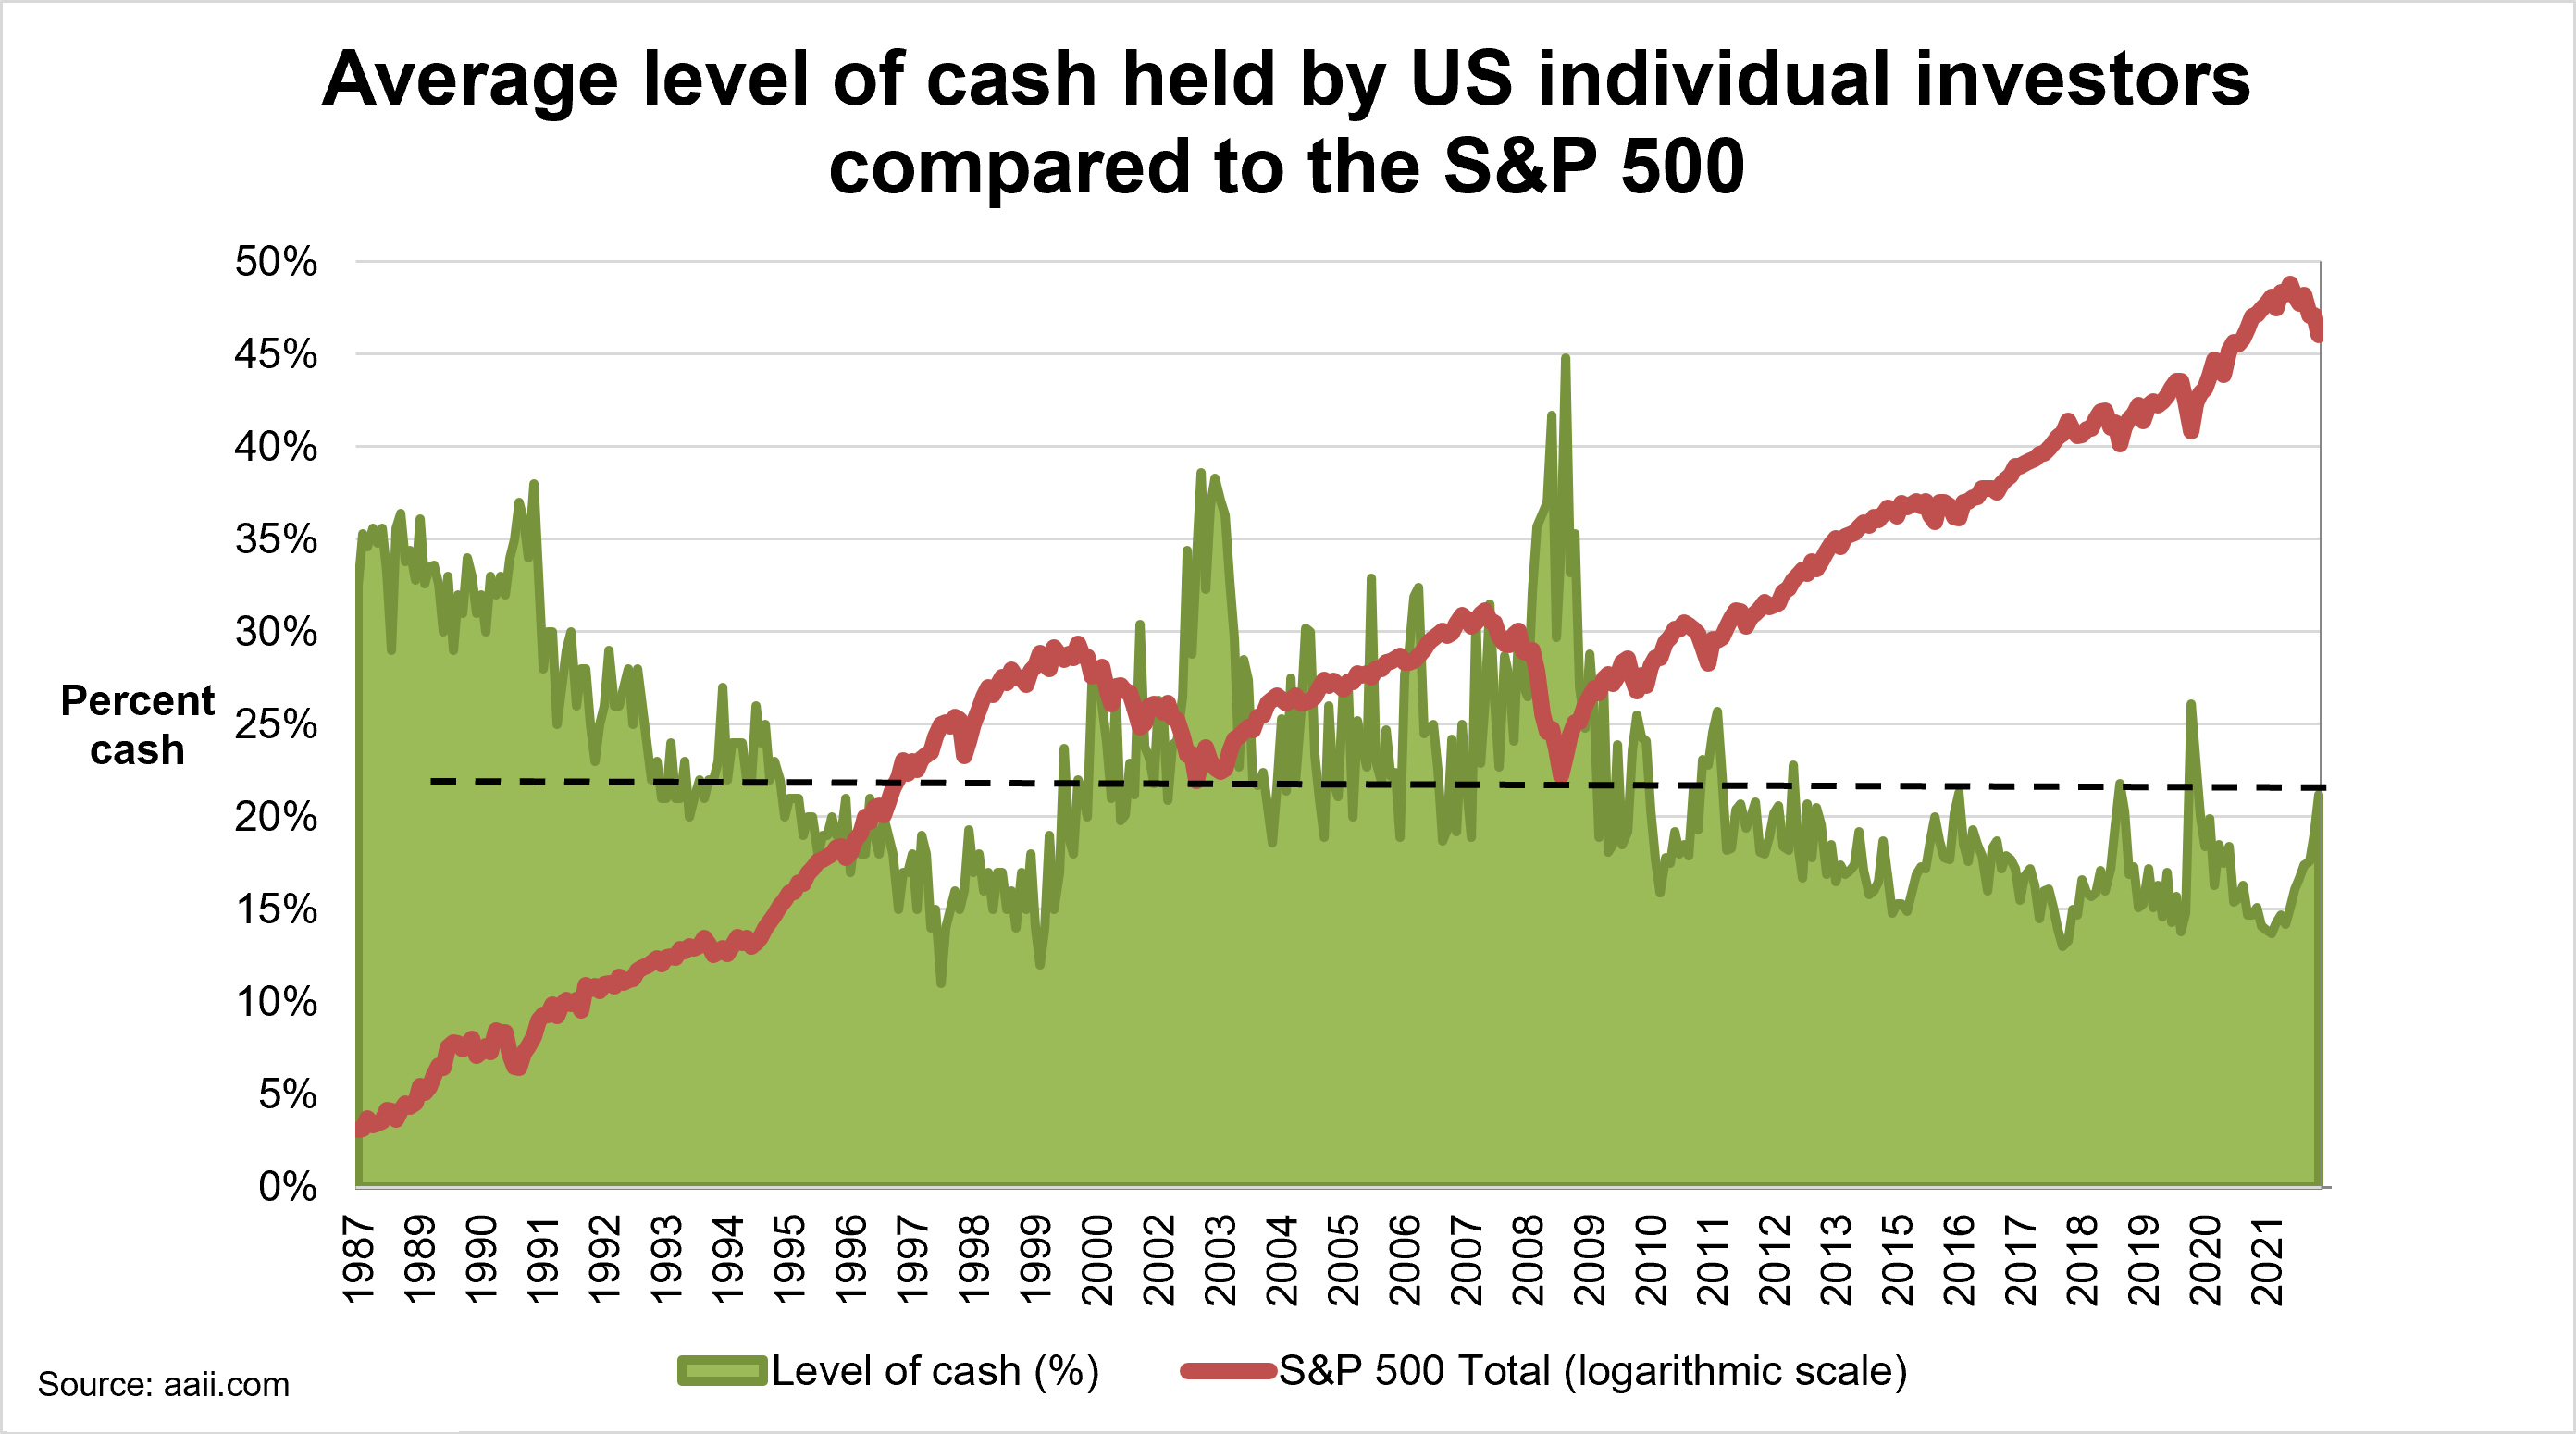
History proves that it is not. The graph above shows us that the cash level reached 26.1% in March 2020. Looking back, wasn’t March 2020 the perfect time to have 0% in cash?
Some readers will accuse me of being a Monday morning quarterback since it is indeed easy to comment on the past. However, this inverse relationship between the level of cash in one’s portfolio and the level of stock markets is not new. To prove the point, I pulled out the level of US individual investor cash since December 1987 (in green). I also overlayed the performance of the S&P 500 over the same period (in red). The result is fascinating!
What does this graph tell us?
First, the average individual investor has too much cash on hand all the time. Between 1987 and 2022, the lowest level of cash on record was 11%, in March 1998. Over this period of approximately 35 years, the average level of cash was 22% of an investor’s portfolio. Even if cash can provide a slight return, it certainly does not approach the stock market return of 10.5% compounded annually achieved during this period. Too much cash, for several years, limits long-term returns.
The second point is that do-it-yourself investors don’t deploy their cash when opportunities arise. In September 2002, retail investor cash was 38.6%. This period corresponds to the bottom of the stock market following the bursting of the technology bubble. In March 2009, these same investors had 44.8% of their portfolios in cash, which corresponds precisely to the trough of the financial crisis of 2008-09.
Conclusion: Individual investors are failing to deploy their cash properly.
Wouldn’t the logic be to see the level of cash on hand drop as the markets correct? If the March 2009 low wasn’t the perfect opportunity to deploy cash, when would it be?
When the markets correct, I have the impression that investors wait before deploying their cash because they hope to buy at the bottom of the market. Unfortunately, this is an almost impossible thing to do. Waiting for the bottom, they miss the dip and miss out on the bounce, leaving a lot of money on the table. If you’re a long-term investor, it’s okay to be fully invested before the market bottoms out.
Does your current portfolio have too much cash? If so, history tells us that you will rarely find the precise moment to deploy your cash. At the moment, for example, it is impossible to know whether the markets will continue to fall. However, I am convinced that the recent decline very likely offers you some opportunities to deploy at least some of your cash.
Jean-Philippe Legault, CFA
Financial analyst